Visual reports and infographics
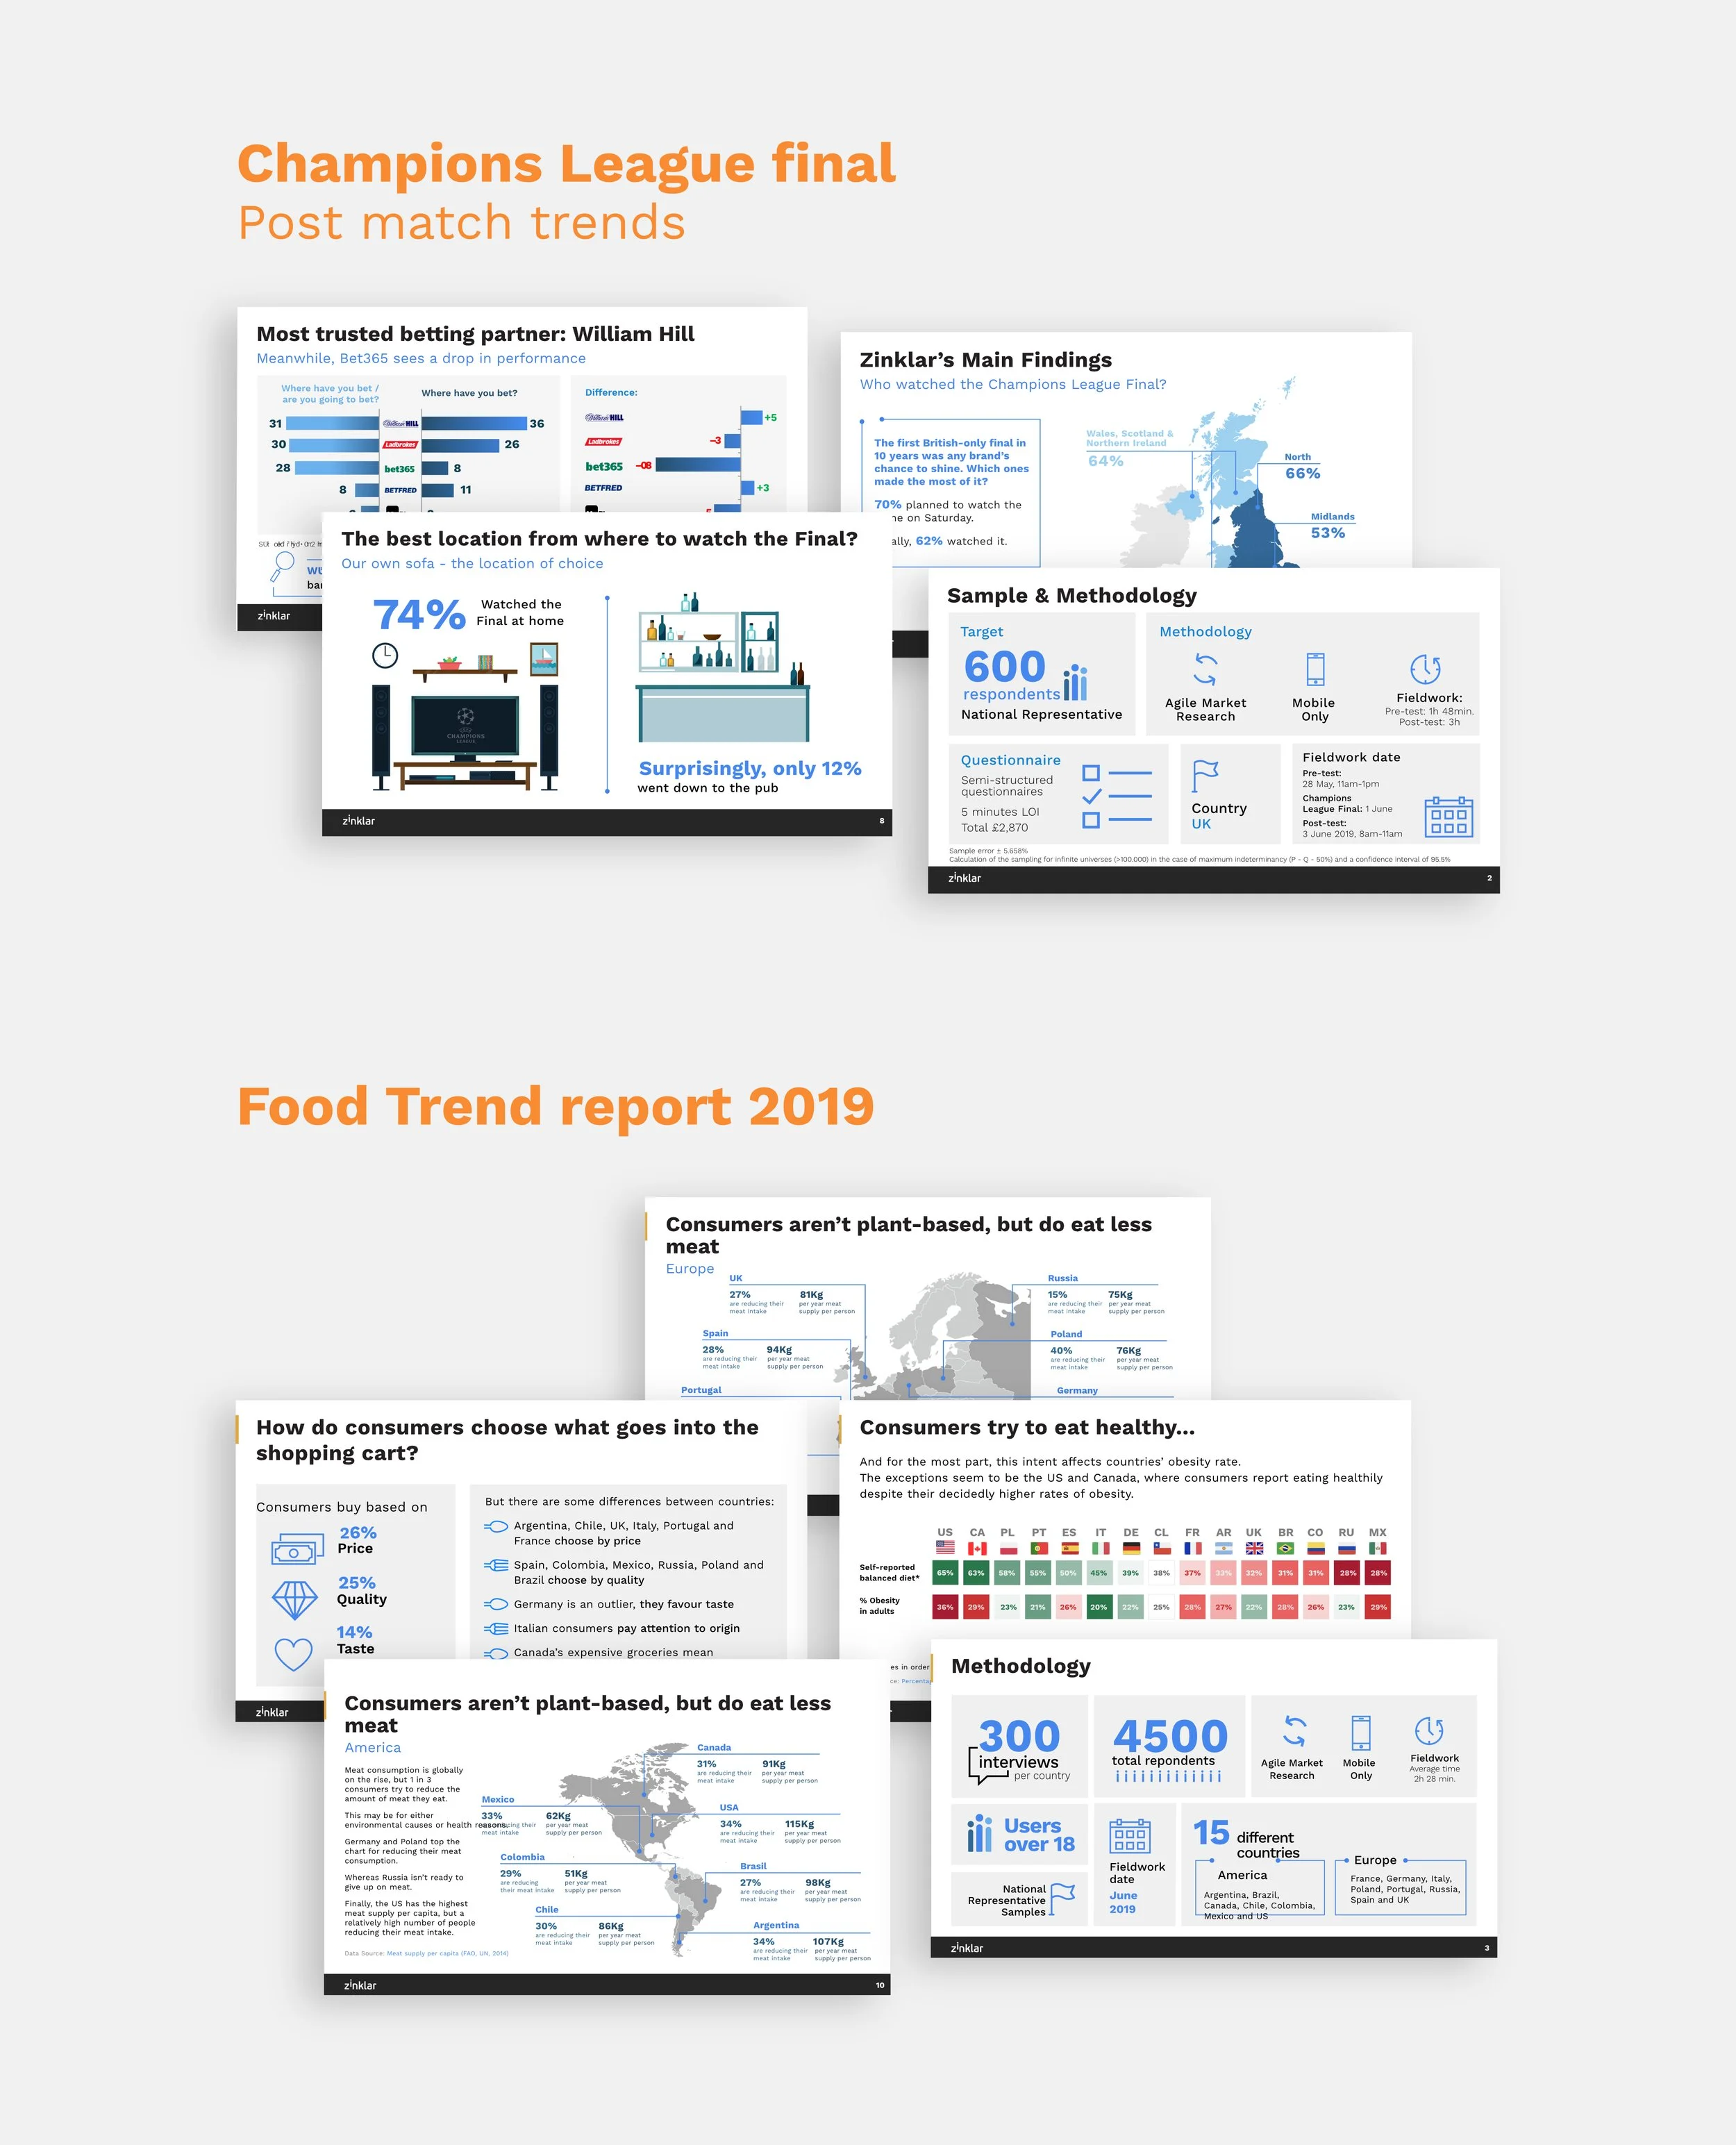
As part of the marketing department of a market research start-up, we regularly launched studies to understand what was trending among the users we had access to across different geographies. Sometimes, we shared the findings with our clients and prospects in the form of reports.
To make them more interesting and easier to read, I made them into visual reports or infographics. These worked better for the Sales team as conversation openers, and they also helped the Research department communicate their findings to the company in a much more accessible way.